🎙 Podcast Version
2-host dialogue — ALEX & SAM discuss this course.
Mastering the Compound Fulcrum: Advanced Chart Patterns and Compounding in Financial Markets
Overview
This course delves into the advanced technical analysis of the "compound fulcrum," a powerful and often overlooked chart pattern used by experienced traders to predict significant market reversals and continuations. We will explore the foundational principles of compounding in finance and how they interact with price action to reveal deeper market dynamics. By understanding this pattern, learners will gain a superior framework for identifying critical turning points and managing risk in volatile markets.
Background & Context
Technical analysis (TA) is the study of past market data, primarily price and volume, to forecast future price movements. While many chart patterns exist, some are far more potent than others, relying on the principle of compounding—the idea that sequential, smaller price movements accumulate to create larger, more significant trends. The compound fulcrum is one such pattern that illustrates how multiple points of support and resistance, when compounded together, create a powerful pivot point for major shifts in market direction. This pattern moves beyond simple single-point support/resistance analysis by incorporating the cumulative weight of market momentum.
The existence of such complex patterns addresses the fundamental problem of unpredictability in financial markets. Markets are constantly influenced by complex psychological factors, institutional movements, and random events. Chart patterns like the compound fulcrum attempt to systematize these chaotic movements by identifying predictable geometric relationships formed by supply and demand. It fits into the broader landscape of TA by bridging the gap between simple indicator readings and the holistic interpretation of multi-layered price structure.
Core Concepts
The Compound Fulcrum
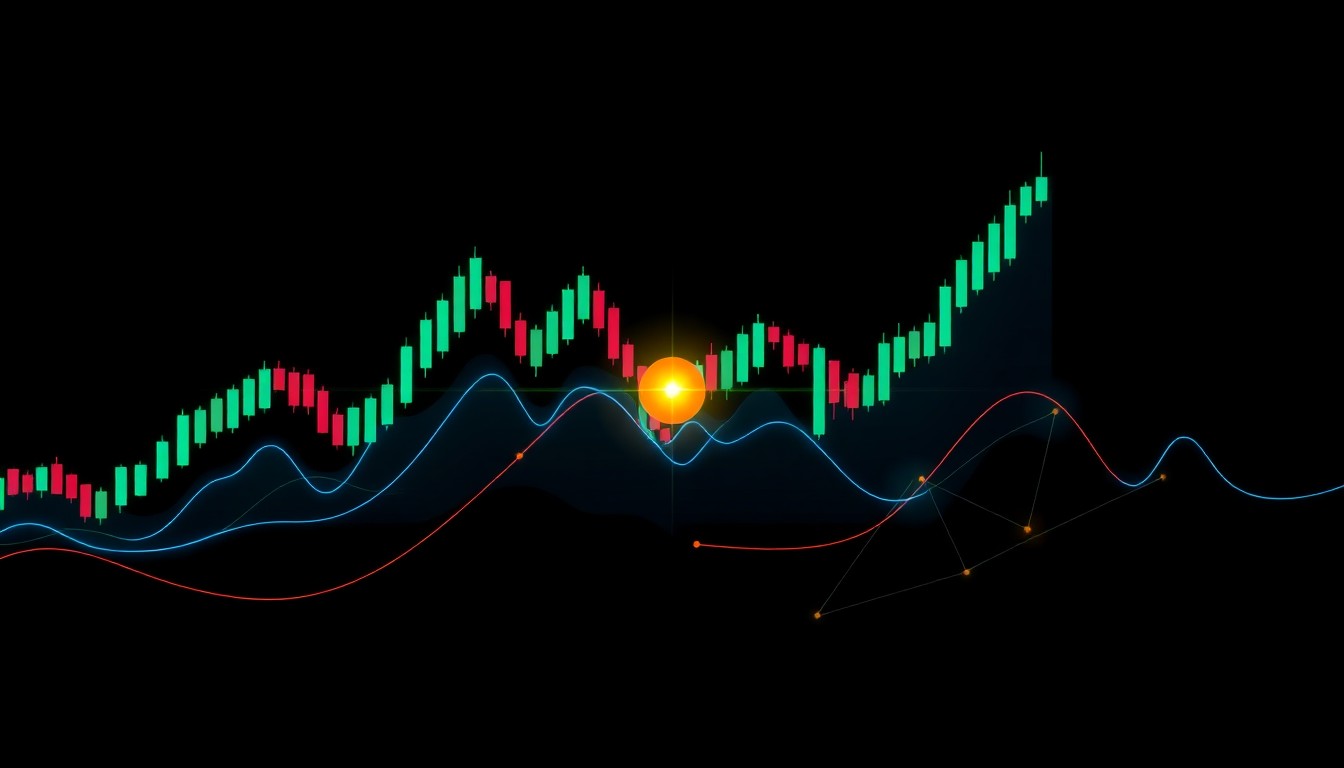
The compound fulcrum is an advanced chart pattern that signifies a critical turning point in market sentiment, formed by the interaction of multiple, overlapping support and resistance levels. Unlike a simple fulcrum, which relies on a single point of equilibrium, the compound fulcrum involves several converging levels where supply and demand exert equal, yet conflicting, influence. This pattern suggests that the market is at an inflection point, requiring a significant shift in momentum before the next major price movement occurs.
This pattern is formed when an initial market trend is challenged by a series of intermediate support levels, and these levels converge at a central fulcrum, signaling that the previous trend's momentum is exhausted and a new direction is likely to emerge. It requires careful observation of volume and price action across multiple timeframes to confirm the validity of the fulcrum, ensuring that the anticipated reversal is backed by significant market conviction.
Compounding in Finance
Compounding is the process where the returns generated from an investment are reinvested, allowing the earnings themselves to generate further earnings. In the context of chart patterns, compounding refers to the accumulation of market forces; small, successive price movements (support breaks, resistance failures) are not isolated events but rather accumulate to form a larger, more significant structural shift. This principle dictates that market shifts are rarely singular; they are the result of the compounding effects of many smaller, incremental decisions made by buyers and sellers.
When applying compounding to technical analysis, it means analyzing how multiple price levels (e.g., three support zones) successively break down or hold, adding weight to the overall probability of a reversal. The effect is that the market doesn't react to one level in isolation; it reacts to the cumulative pressure exerted by all preceding levels, which defines the true "fulcrum" of the current market structure.
Deep Dive
Anatomy of the Compound Fulcrum
To identify a compound fulcrum effectively, an analyst must observe the confluence of several factors simultaneously. This is not merely about drawing lines; it is about assessing the volume and the timing of the price interaction at these critical levels. Typically, a compound fulcrum involves at least three distinct support zones and three distinct resistance zones converging at a single central point.
The formation process often involves an initial trend establishing a baseline, followed by corrective pullbacks where the price tests sequential levels. The "compound" aspect arises when these pullbacks are not isolated but demonstrate a systemic failure across multiple price barriers, indicating that the underlying balance of market forces has been severely disrupted. The precise location of the fulcrum is where the maximum amount of market exhaustion is concentrated, making it the most critical point for predicting the subsequent direction.
The Role of Support and Resistance
Support and resistance levels are crucial reference points in technical analysis, representing areas where buying (support) or selling (resistance) pressure historically dominates price action. In a simple pattern, a single line serves as the fulcrum. In a compound fulcrum, these levels must be analyzed in a layered manner. The higher the number of levels that align and converge at the fulcrum, the stronger the signal that the market structure is unstable and a major shift is imminent.
Understanding this layering helps distinguish between temporary fluctuations and genuine structural shifts. A market can easily bounce off a single resistance level; however, it requires immense pressure and confirmation when it fails to breach multiple, overlapping resistance levels, which is the defining characteristic of the compound fulcrum. This layering allows the trader to assess not just where the price is going, but the degree of collective agreement among market participants.
Practical Application
The compound fulcrum is most effective when applied across different timeframes (e.g., daily, weekly, and hourly) to ensure that the observed pattern reflects sustained market sentiment rather than short-term noise.
Application Scenario 1: Identifying a Bearish Reversal
Imagine analyzing a major currency pair over a multi-week period. The price trend was gradually declining. The trader identifies three distinct, consecutive support zones: Zone A (strong historical support), Zone B (intermediate support), and Zone C (major psychological support). When the price subsequently pulls back and attempts to breach all three zones simultaneously, converging at a central point (the compound fulcrum), this suggests the accumulated selling pressure is overwhelming. This pattern signals a high probability of a significant bearish reversal. The trader would use this signal to prepare for potential short positions, as the compounded failure of support indicates a structural shift.
Application Scenario 2: Confirming a Bullish Reversal
Conversely, if a market is in a downtrend, and the price attempts to rally, the trader looks for the convergence of three resistance zones. If the price struggles repeatedly to break through these layers of resistance, failing to achieve higher highs despite continuous buying attempts, the formation of a compound fulcrum suggests that the selling pressure has exhausted itself. This pattern signals a likely bullish reversal, justifying the initiation of long positions once the fulcrum is confirmed.
Application Scenario 3: Risk Management
When a compound fulcrum is identified, risk management becomes paramount. Because the pattern indicates a major structural shift, traders should avoid small, speculative trades near the fulcrum. Instead, they should wait for confirmation—such as a break above or below the fulcrum with significant volume—before executing large positions. The pattern provides a high-probability setup, but execution must be tempered by caution until the compounded momentum is confirmed.
Key Insights & Takeaways
- The compound fulcrum is an advanced chart pattern that signals a critical turning point based on the convergence of multiple support and resistance levels.
- True market shifts are revealed through the compounding effect of sequential price movements, not by isolated points.
- A compound fulcrum indicates that market momentum has been exhausted because multiple, overlapping levels of support or resistance have failed simultaneously.
- The formation of this pattern requires observing confluence across multiple timeframes and multiple price levels to ensure validity.
- This pattern is a strong predictor of major market reversals because it reflects a deep imbalance in the collective sentiment of buyers and sellers.
- Traders must use the fulcrum not as an execution point, but as a high-probability setup for confirming a structural shift.
- When a compound fulcrum forms, risk management should be tightened, as the potential for a significant, sudden move is high.
Common Pitfalls / What to Watch Out For
A common pitfall for beginners is viewing the compound fulcrum as a simple zone where the price will simply reverse. Beginners often fail to account for the "compounding" aspect, treating it as a single-point pivot instead of a multi-layered failure of market structure.
Another critical mistake is ignoring volume. A simple price confluence is insufficient; the pattern must be confirmed by significant volume accompanying the failed price attempts across all layers. Relying solely on price levels without volume analysis can lead to false signals.
Traders must be careful not to overreact to the pattern. While it signals a high probability of a shift, the actual entry or exit point should be validated by subsequent price action crossing the fulcrum with strong momentum, rather than immediately acting on the pattern alone.
Review Questions
- How does the concept of "compounding" change the way you view a chart pattern compared to a simple, single-point support/resistance level?
- Describe the specific structure that must be present for a pattern to be classified as a compound fulcrum, and what does the convergence of these levels imply about market psychology?
- If a trader identifies a compound fulcrum, what are the three most crucial considerations they must apply to their risk management strategy before initiating a trade?
Further Learning
To build upon this knowledge, a reader should explore the following topics:
Advanced Technical Analysis:
- Order Flow Analysis: Learning how to analyze the actual flow of buy and sell orders, which provides a deeper understanding of the institutional forces behind price movements.
- Market Microstructure: Understanding the mechanics of how exchanges function and how liquidity affects price formation.
Related Financial Topics:
- Market Psychology: Studying the behavioral economics of traders to understand the collective fear and greed that drive the compounding of market forces.
- Volatility and Risk Management: Developing sophisticated strategies for managing the increased risk that arises when trading major structural turning points.